Facilities Condition Assessments
Condition data you can plan and fund from
K12CG assesses every major building system at the component level. We document condition, deficiencies, quantities, remaining useful life and planning-level costs, then roll them into a Facility Condition Index and a 15-year needs forecast. It becomes the foundation of your master plan.
You cannot prioritize what you have not measured
Many districts know their buildings are aging. Fewer can say which roofs, HVAC units or electrical systems will fail next, or what replacing them will cost. Without that detail, capital decisions get made by urgency and anecdote.
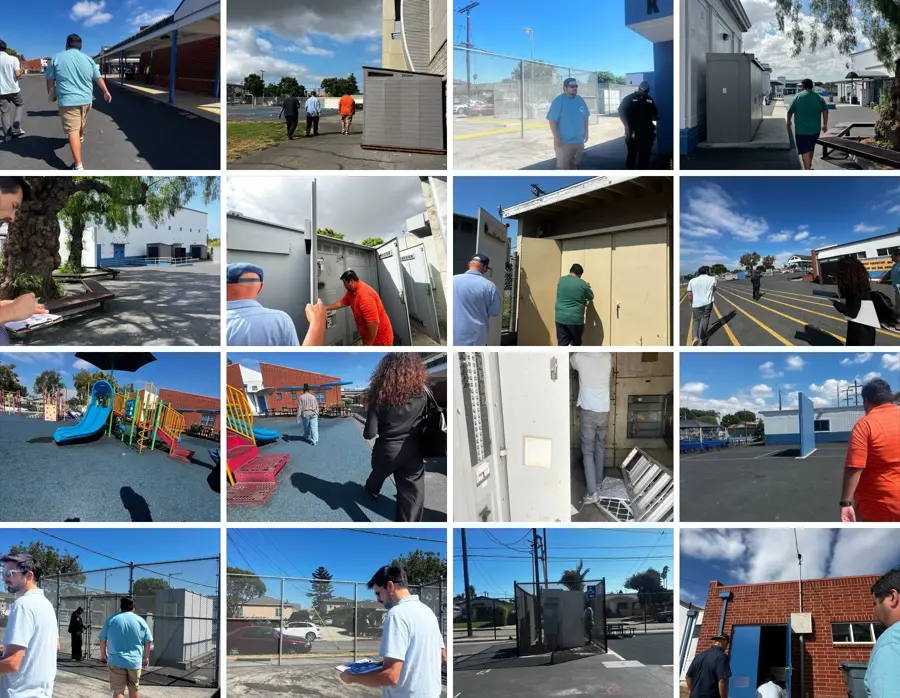
A facilities condition assessment replaces guesswork with evidence. It records each asset, its age, its observed condition and its expected remaining life. It prices the work and shows when it will be due.
K12CG delivers that information as editable data, not just a report. It feeds the master plan, bond planning and state funding work, and the district can keep it current.
Scope
What’s included
Asset-level inventory
Roofing, HVAC, electrical, plumbing, envelope, interiors, site and more, recorded by building and system.
Observed condition and scoring
Trained assessors walk every site and score each asset on a consistent scale, so campuses can be compared fairly.
Useful life analysis
Year installed, expected useful life and remaining useful life for each asset, adjusted for what we see in the field.
Deficiencies, quantities and photographs
Each deficiency is described, quantified, located and photographed. Where it helps, aerial imagery adds roof, drainage and site vantage points a walk-through cannot efficiently capture.
Planning-level cost model
Repair and replacement costs estimated for each need, with assumptions stated so the numbers can be updated over time.
Facility Condition Index (FCI)
The FCI compares the cost of needed work with the replacement value of the facility. It gives one clear, comparable measure for every building and campus.
Immediate, 1-, 5-, 10- and 15-year horizons
Needs are sorted by when they will come due, so the district can separate urgent repairs from long-range capital planning.
Accessibility, life-safety and site
Accessibility, fire and life-safety, paving, drainage and site conditions are flagged alongside building systems, then rolled into a prioritized deferred maintenance list.
Aerial Facility Intelligence
Vantage points a walk-through can’t reach
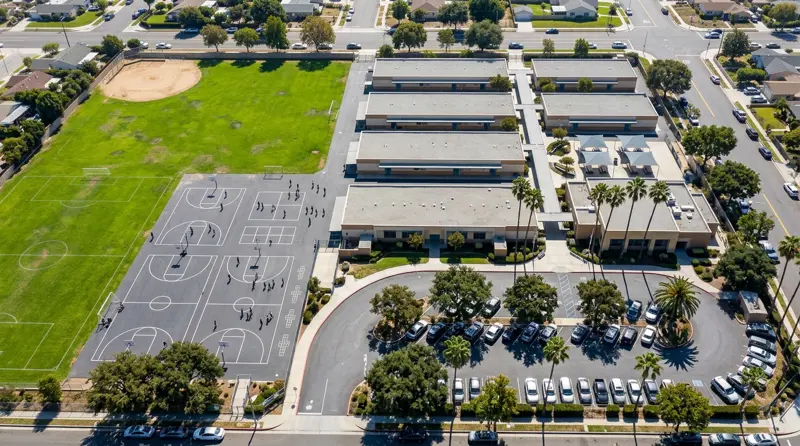
During the assessment, drone capture documents roofs, drainage, hardscape and site conditions that are unsafe or slow to reach on foot. Aerial findings are logged with the ground findings, so they feed the same condition scores, deficiencies and cost estimates.
- Roof and envelope conditions
- Drainage patterns and ponding
- Hardscape, fields and inaccessible areas
- Site circulation and campus context
Flights are planned around school schedules and flown by FAA-certified remote pilots. Aerial data supports professional assessment; it does not replace it.
How we work
Assess. Align. Advance.
- 01
Assess
Collect existing drawings, records and work orders. Walk every site and document each asset’s condition, age and deficiencies.
- 02
Align
Agree on scoring standards, cost assumptions and time horizons with facilities staff so the data reflects how the district operates.
- 03
Prioritize
Calculate FCI by building and campus. Sort needs by urgency and horizon, and flag safety and life-cycle risks.
- 04
Fund
Group related needs into fundable projects and identify which may fit deferred maintenance, bond or state funding sources.
- 05
Deliver
Hand over the data set, dashboards, site reports and photo record, ready to support the master plan and project scoping.
- 06
Update
As work is completed or new issues appear, staff update the records. The FCI and forecasts stay current without starting over.
Deliverables
What your district keeps
- Asset-level condition database, editable by district staff
- Facility Condition Index by building, campus and district
- Immediate, 1-, 5-, 10- and 15-year capital needs forecast
- Deficiency log with locations and photographs
- Planning-level cost model with documented assumptions
- Site condition reports for each campus
- Capital bundling recommendations
- Assessment data structured for the Interactive FMP
Keep exploring
Try it, read it, see it
FCI & Capital Needs Calculator
Get a Facility Condition Index in five seconds, then build a system-by-system capital needs profile across immediate, 1-, 5-, 10- and 15-year horizons.
Calculate FCI District guideUnderstanding FCI and Facilities Condition Assessments
The Facility Condition Index turns a detailed condition assessment into a single, comparable number. It is a useful planning shorthand, as long as you know what it does and does not tell you.
Read the guide Interactive FMPSee how the data lives on
Explore a demo of the Interactive Facilities Master Plan, with district, school and building drill-downs.
View the demoOfficial resources
Straight from the source
Links open state agency websites in a new tab. Requirements change, so always confirm current rules with the agency.
FAQ
Questions districts ask us
Let’s compare approaches
Want a second perspective before you decide? We’ll talk through your facilities needs, options, and how we would approach the work, with no sales presentation required.
Related services
Works well with
Facilities Master Planning
A districtwide plan that ties condition, capacity and educational need to a prioritized, fundable capital program.
Explore the service PrepareBond Advisory & Funding Strategy
Defensible project lists, phasing and funding strategies, with support for transparency, community understanding and responsible bond implementation.
Explore the service DeliverProgram & Project Management
Owner-side controls, procurement and cost stewardship that help deliver your capital priorities on budget and with fewer surprises.
Explore the serviceGive us 10 minutes. Let’s compare approaches.
Tell us where your facilities stand and what your board is asking. We’ll share how districts like yours are approaching it. No pitch deck, no obligation.